
Understanding the Systems Shaping the Next Decade
The manifesto: why we believe the next ten years belong to the physical world — and why everything Red Cardinal covers is one connected system, not seven separate stories.
Bottom Line Up Front
For roughly forty years, the surest path to wealth in America ran through paper: falling interest rates, rising asset prices, offshored production, and financial engineering. That era is ending — not with a crash, but with a change of subject.
The next decade's defining projects are physical. Power plants and transmission lines. Factories and shipyards. Munitions and drones. Houses. Data centers. New medicines. After a generation of optimizing spreadsheets, the developed world is pouring concrete again.
This is not seven separate stories. Money, energy, compute, industry, defense, housing, and medicine form one connected system, and the connections are where understanding — and opportunity — actually live.
The forces driving the rebuild are durable: great-power rivalry, demographics, an aging grid meeting new demand, a decade of underbuilt housing, and AI's collision with the physical world. None resolves quickly. All are funded.
Red Cardinal Research exists to map this system. This piece is the map. Every other report in the archive is a closer look at one of its territories.
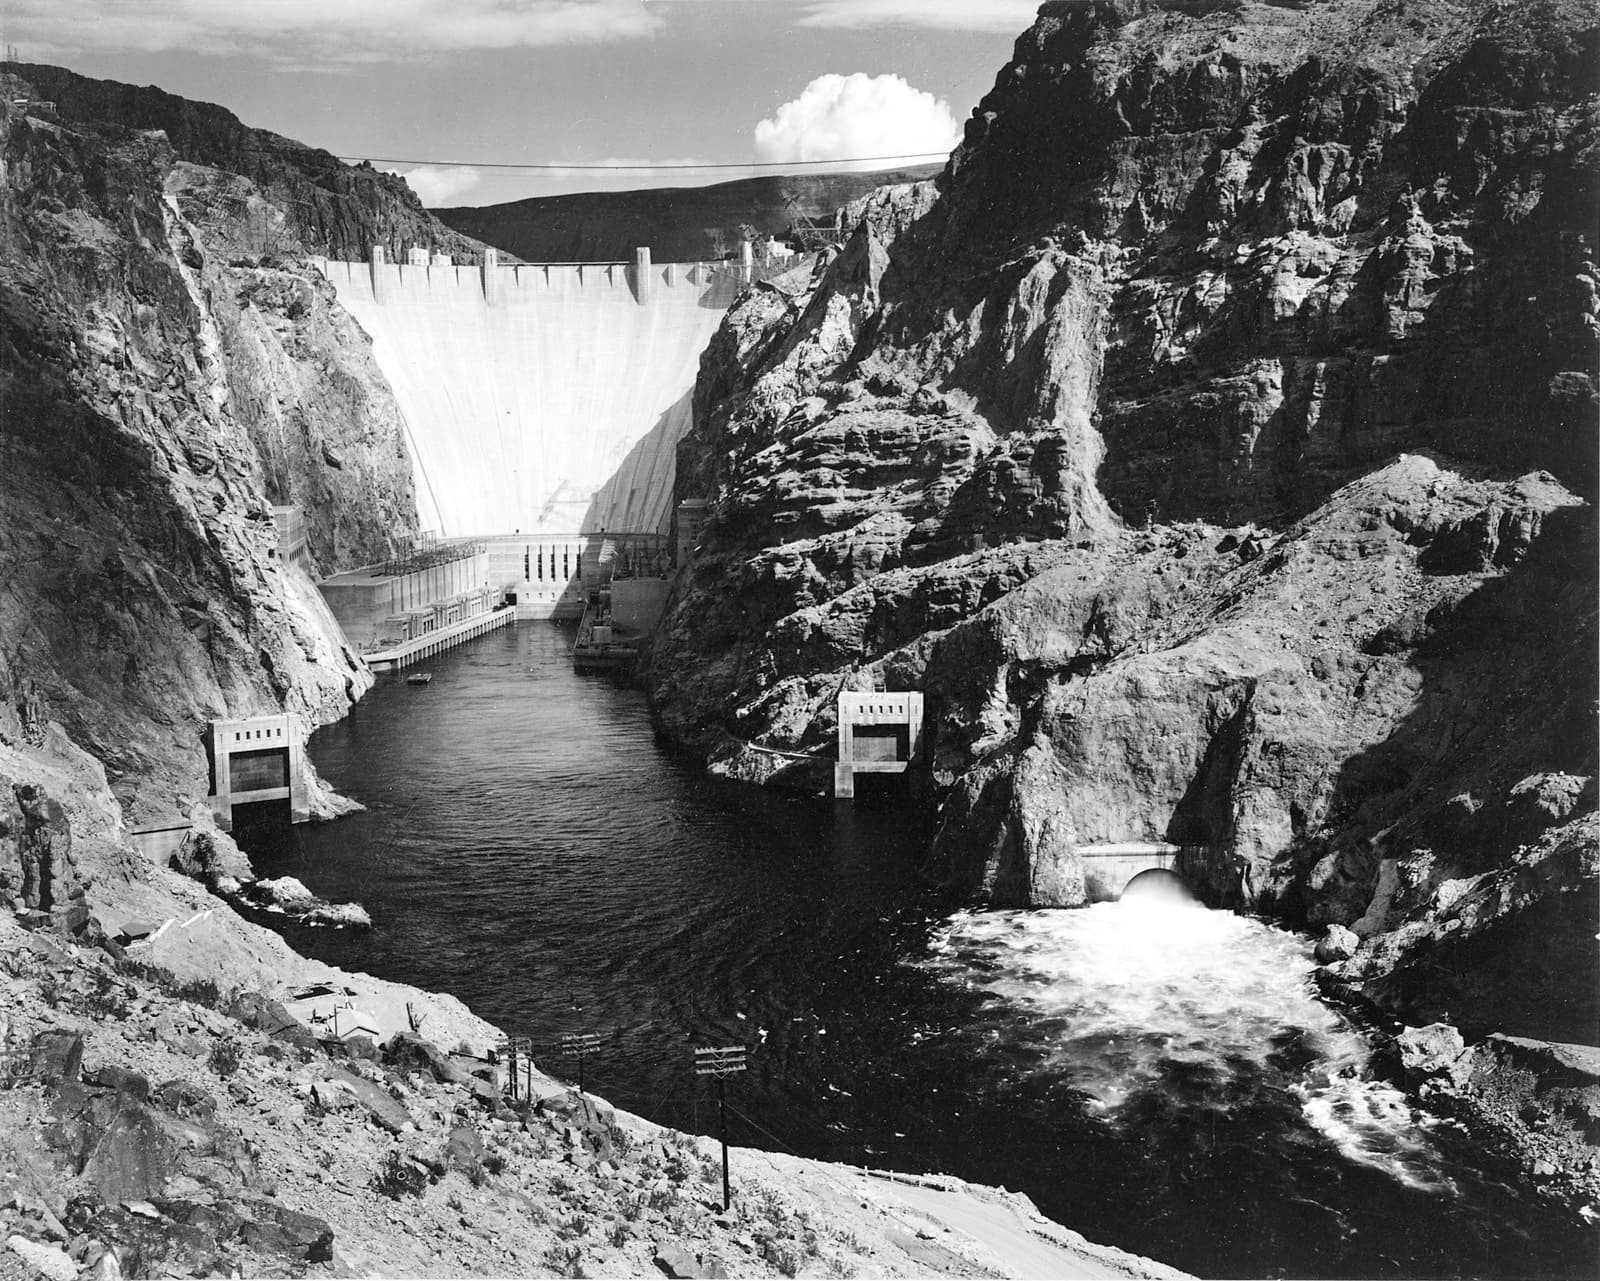
The photograph on this page
In 1941, the Department of the Interior hired Ansel Adams — the great romantic of untouched wilderness — to photograph, of all things, government infrastructure. He went to Boulder Dam and made the image above: a wall of concrete holding back a river, and threading through the canyon beneath it, the thing the dam was actually for. Wires. Power lines walking off toward Los Angeles and Phoenix, cities that were about to become possible at scale because this structure existed.
Nobody in that photograph's world doubted that building physical things was how a country got richer. The dam, the grid, the interstate system, the arsenal that won a world war — that was the economy. Then, starting around 1981, something subtle happened: interest rates began a forty-year descent, and the returns migrated from building things to owning claims on things. The factory moved to Shenzhen; the value moved to the balance sheet. An entire generation of talent learned that the highest use of intelligence was arranging capital, not directing it at matter.
None of that was irrational. It was the correct response to the era's prices. But eras end, and the tell is never a headline — it's when several unrelated-looking systems start moving in the same direction at once. That's what the archive documents, and it's worth walking the whole map once, slowly.
Walking the map
Start with money, because everything is priced in it. The forty-year tailwind of falling rates is gone, and government debt service has become a top-tier budget line — the regime we described in The Fiscal Dominance Era. When financial assets stop getting an automatic boost from cheaper money, capital goes looking for real returns, and it finds them in the physical backlog the last era neglected.
Energy is the first thing it finds. U.S. electricity demand is growing for the first time in a generation — AI, electrification, and reshored factories all pulling on a grid designed for a flatter world. Nuclear plants are being restarted for the first time in American history; gas turbines are sold out toward 2030; transmission is the decade-long constraint. Whoever controls electrons controls what gets built next.
Compute is the new heavy industry. The strange truth of artificial intelligence is that a software revolution turned into a construction story: land, concrete, cooling, and gigawatts, as we traced in Electricity Is the New AI Bottleneck. The most advanced technology in human history is bottlenecked by the oldest — the grid Adams's wires became.
Industry and defense are the same rebuild wearing two uniforms. Reshoring is building factories at a pace unseen since the 1970s, while the arsenal — hollowed out by thirty years of peacetime efficiency — is being rebuilt shell by shell, a story we told in The Arsenal Gap. Both projects collide with the same wall: a workforce retiring faster than it can be replaced, which is why automation is not a threat to this economy but its enabling condition.
Housing is the rebuild deferred. America underbuilt homes for fifteen years, then froze what existed under a blanket of 3% mortgages nobody will surrender. The shortage is structural, the political pressure is compounding, and construction — eventually — is the only exit.
And medicine is the rebuild of the body's own systems. GLP-1 drugs treating obesity at scale may be the single largest healthcare shift of the decade, quietly rewiring food, insurance, and healthcare economics — proof that the physical decade includes biology.
Seven territories. Now notice what happens when you stop looking at them separately. The fiscal regime sets the price of money that funds the data centers that strain the grid that demands the copper that comes from mines that take two decades to permit — while defense competes for the same factories, workers, and metal, automation answers the labor gap in both, and the whole contest runs on electricity. Pull any thread in this archive and you arrive at every other thread. That is the thesis. Not seven stories: one system, observed from seven angles.
This is also why the publication is named what it's named. A cardinal survives winter without migrating, without bulk, without any obvious advantage except one: pattern recognition. It holds a map in its head — where food appeared last February, which feeder fills at dawn, which rustle is wind and which is a hawk — and it updates that map every day while other birds flee south. It doesn't see a different forest than the sparrows. It reads the same forest better. That is the entire ambition of this archive: the same public facts everyone else has, held in one connected map, updated daily, remembered across seasons.
Key Judgments
- Physical-economy sectors — energy, industrials, materials, defense, infrastructure — will take a structurally larger share of investment and policy attention through 2035 than they did in the prior two decades. If capital spending in these sectors rolls over durably, this thesis is wrong.
- Electricity is the master constraint of the decade; nearly every other system's growth rate will be gated by it somewhere.
- The rebuild is slower than markets want but longer than markets price: multi-decade physical timelines meeting durable, bipartisan funding is the defining mismatch of the era.
- Labor scarcity is permanent enough to make automation a structural theme rather than a cyclical one.
- The connections between these systems will matter more than any single system: the biggest surprises of the decade will emerge at the seams — power prices meeting politics, defense meeting labor, AI meeting the grid.
Risks & Counterarguments
The honest case against the whole thesis: physical buildouts have a long history of disappointing the people who financed them. The railroads, the 1990s fiber glut, China's ghost cities — infrastructure eras create civilizational value and destroy investor capital at the same time, and this one could too. AI spending, the cycle's loudest engine, could stall and take sentiment down with it. High rates could choke capital-intensive projects precisely because they're capital-intensive. Governments could fumble permitting reform, leaving demand unmet rather than supplied. And a genuine crisis — fiscal, geopolitical, or financial — could interrupt everything for years. The rebuild being necessary doesn't make it smooth. Our claim is about direction and duration, not about a straight line.
Why It Matters
If the thesis is right, the mental models most people built between 1990 and 2020 — software eats everything, capital-light wins, the physical world is a solved problem — are quietly expiring. The readers who update early will understand the news before it happens: why power bills become politics, why a copper mine matters to an AI company, why a retirement wave shows up in robot orders. That understanding, compounding one report at a time, is the entire product of Red Cardinal Research. This piece is where the map starts. The rest of the archive is the territory.
What We're Watching
- The ratio of real physical investment — factories, power, defense — to GDP, the single cleanest scoreboard for the whole thesis.
- Electricity demand data versus forecasts, the master variable underneath everything else.
- Whether permitting reform for transmission, mines, and housing actually passes and actually shortens timelines.
- The AI capex cycle: the loudest engine, and the one most capable of a sentiment-breaking pause.
- Long-term real interest rates, which set the price of every physical project on this map.
Sources: U.S. Energy Information Administration; Census Bureau construction spending data; Congressional Budget Office long-term outlook; Bureau of Labor Statistics; Department of Defense budget materials; U.S. Geological Survey. This is analysis, not investment advice.